MFT Gateway Performance Testing
1 Overview
This document describes performance testing carried out on a dedicated deployment of the MFT Gateway. The objective of the test was to test the ability of the MFT Gateway to process a steady stream of 1MB files at 100 transactions per second. The tests included the following:
- Receipt of 1MB messages - target 100 TPS using the Large payload EC2 endpoints
- Receipt of 1MB messages - target 100 TPS using the API Gateway endpoints
- Sending of outgoing messages of 1MB in size - target 100 TPS
- Long-running test of 12 hours - target over 1 million messages across 12 or more hours
1.1 Testing Environment
The complete test was conducted within the Amazon AWS environment. The load generator was a single EC2 instance, with the MFT Gateway deployment receiving the messages over the API Gateway and Large payload (EC2) endpoints.
1.1.1 Lambda Function Configuration
The Lambda functions performing the core AS2 operations of the MFT Gateway was configured as follows. Note that the key Lambda functions were allocated 2048M of memory, and allowed the maximum execution delay of 15 minutes.
- MFT-Gateway-AS2-Servlet-Receiver / 2048M / 15 min : Process uploads via Large payload EC2
- MFT-Gateway-AS2-Sender / 2048M / 15 min : AS2 sender
- MFT-Gateway-AS2-Receiver / 2048M / 15 min : API Gateway exposed AS2 receiver
- MFT-Gateway-AS2-Async-Processor / 2048M / 15 min : Async MDN processor
- as2Servicesapiss3UploadTrigger / 512M / 5 min
1.1.2 AS2 Outbound Load Generator
EC2: c3.2xlarge / 8 vcpu / 15G RAM / NW: high / 64-bit
To generate a steady stream of large encrypted and signed messages, we utilized JavaBench, a variant of the popular ApacheBench tool, as described and used in the ESB Performance Testing framework. We saved a signed and encrypted AS2 message in binary form into a file, and this file was submitted by the load generator across multiple iterations, and at the specified concurrency. During testing, initially we hit the network bandwidth limit allowed on the EC2 instance size selected. This was overcome by selecting a ‘c3.2xlarge’ instance with ‘high’ network performance. The average NW utilization at the load generator was ~18 MB/s (megabytes, per second)
JavaBench:
- Binary file of size 1055953 (ie. signed and encrypted size)
- AS2: signed SHA-1 and encrypted 3DES 168-bit, requesting sync MDN
HTTP Headers
AS2-From: hiruload
User-Agent: MFT Gateway
Disposition-Notification-To: hirudinee@adroitlogic.com
AS2-Version: 1.1
From: hirudinee@adroitlogic.com
Message-Id: <537803271628387@mftgateway.com>
Content-Transfer-Encoding: binary
AS2-To: loadtest
Disposition-Notification-Options: signed-receipt-protocol=required,pkcs7-signature; signed-receipt-micalg=required,sha1
Subject: 360 200 "" 5 1MB LB Test01
MIME-Version: 1.0
Content-Type: application/pkcs7-mime; name="smime.p7m"; smime-type=enveloped-data
The AS2 message load simulated 200 concurrent users, with each such user performing 360 requests immediately, one after the other. Each request sends the saved AS2 (signed and encrypted) message of ~1MB to the designated URL. This is repeated across 5 iterations. So the total requests made are 200 x 360 x 5 = 360,000.
nohup ./run.sh 360 200 "" 5 > run.log-$(date +%T) &
1.1.3 Large Payload EC2 Endpoints
EC2: 6 x t3a.medium / 2 vcpu / 4G / 5Gbps burst The large payload endpoints were configured with an auto-scaling EC2 server cluster, fronted by an Application Load Balancer with stickiness set to off. The auto-scale group had 6 EC2 instances of the above mentioned ‘t3a.medium’ configuration, with each running Apache Tomcat 8.5.51 with Java 1.8.0_302-b08, and configured with 2G of heap memory (i.e. -Xms2G / -Xmx2G). Note that the task of these EC2 instances is simply the acceptance of AS2 messages over HTTP/S and uploading of the request to S3. The expectation was to configure a single EC2 instance / Tomcat node, to process a 100 concurrent connections at a time. Thus, the following Tomcat configuration was used.
AS2 receiver
<Connector port="8080" protocol="org.apache.coyote.http11.Http11NioProtocol"
   address="0.0.0.0"
   asyncTimeout="600000"
   connectionTimeout="600000"
   maxKeepAliveRequests="10000"
   processorCache="300"
   acceptCount="0"
   maxThreads="100"
   maxConnections="100"
   disableUploadTimeout="false"
   redirectPort="8443" />
Tomcat Health check
<Connector port="8090" protocol="HTTP/1.1"
   address="0.0.0.0"
   asyncTimeout="30000"
   connectionTimeout="30000"
   maxKeepAliveRequests="5"
   processorCache="300"
   acceptCount="0"
   maxThreads="5"
   maxConnections="5"
   disableUploadTimeout="false" />
Other Configuration
# S3 transfer related properties
s3.core.threads=20
s3.max.threads=200
s3.idle.keepalive.sec=60
s3.multipart.upload.threshold=5248000

# AWS clients related properties
aws.request.timeout=-1
aws.socket.timeout=120000
aws.client.execution.timeout=0
aws.max.error.retry=0
aws.max.connections=150

# Thread pool related properties
executor.core.threads=20
executor.max.threads=200
executor.idle.keepalive.sec=60
1.1.4 AS2 Sending and Loopback testing
To test the sending out of AS2 messages, we created a shell script copying a file of size 1MB into the S3 path to be picked up by the MFT Gateway AS2 send flow. Files were copied at a rate of 100 per second. These files were signed and encrypted, and then sent over to the API Gateway based endpoints as a loopback test.
2 Test Execution and Observations
2.1 Load test to Large Payload Endpoints
The following observations were recorded during the execution of the first load test, sending requests to the large payload endpoints, on the EC2 load balancer.
2.1.1 AS2 Outbound Load Generator Observations
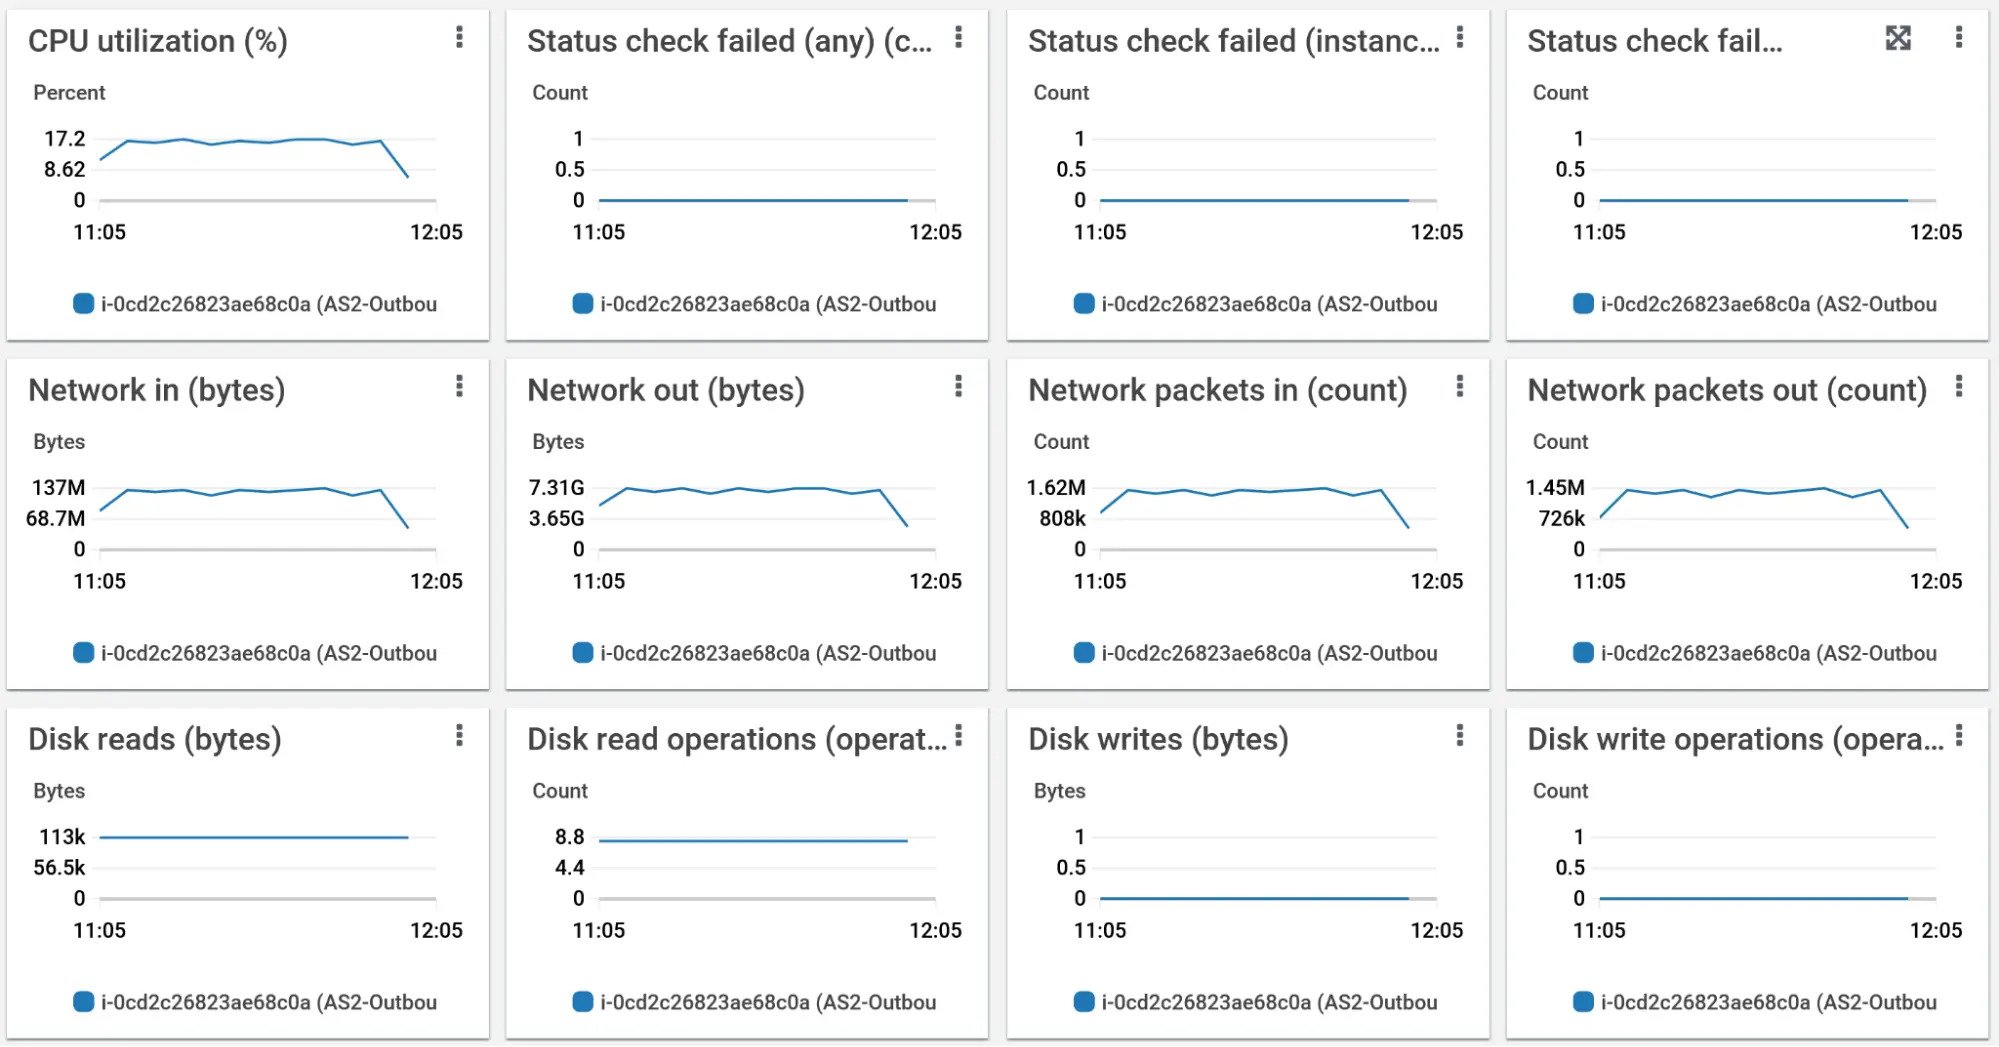
We can see a steady CPU utilization at around 17% during the testing. The network utilization also reflects this, and everything seems exactly as expected.
2.1.2 Load Balancer Observations
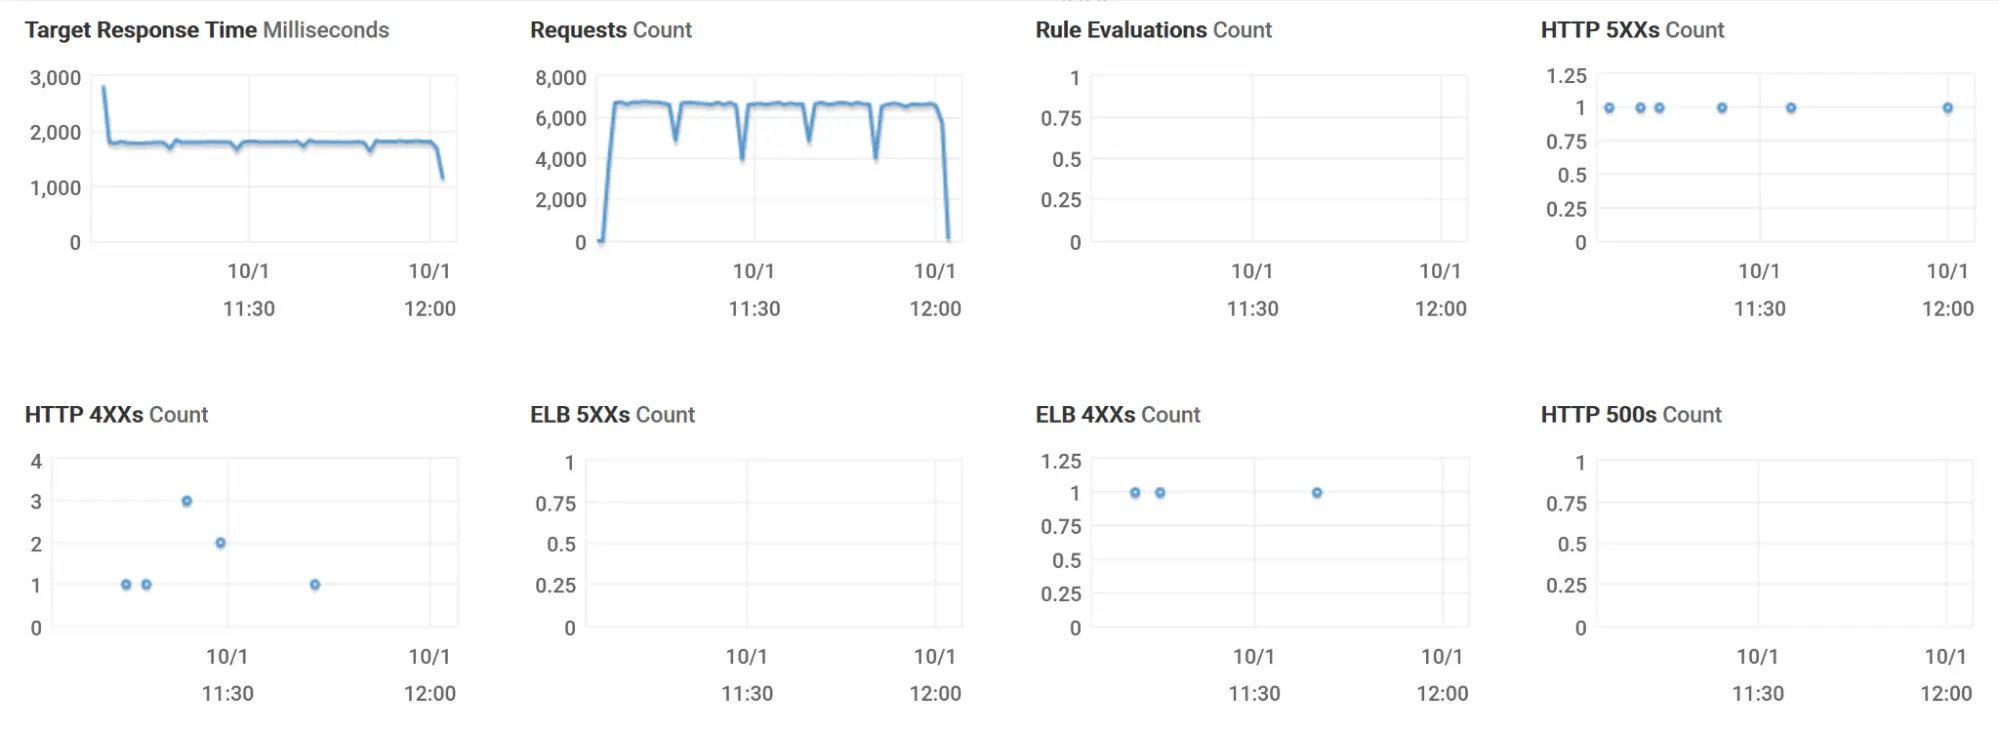
We can see that the load balacer was responding back to each request with a response time of approximately 2,000 ms - or 2 seconds. We also see a few HTTP 4xx errors and ELB 4xx errors.
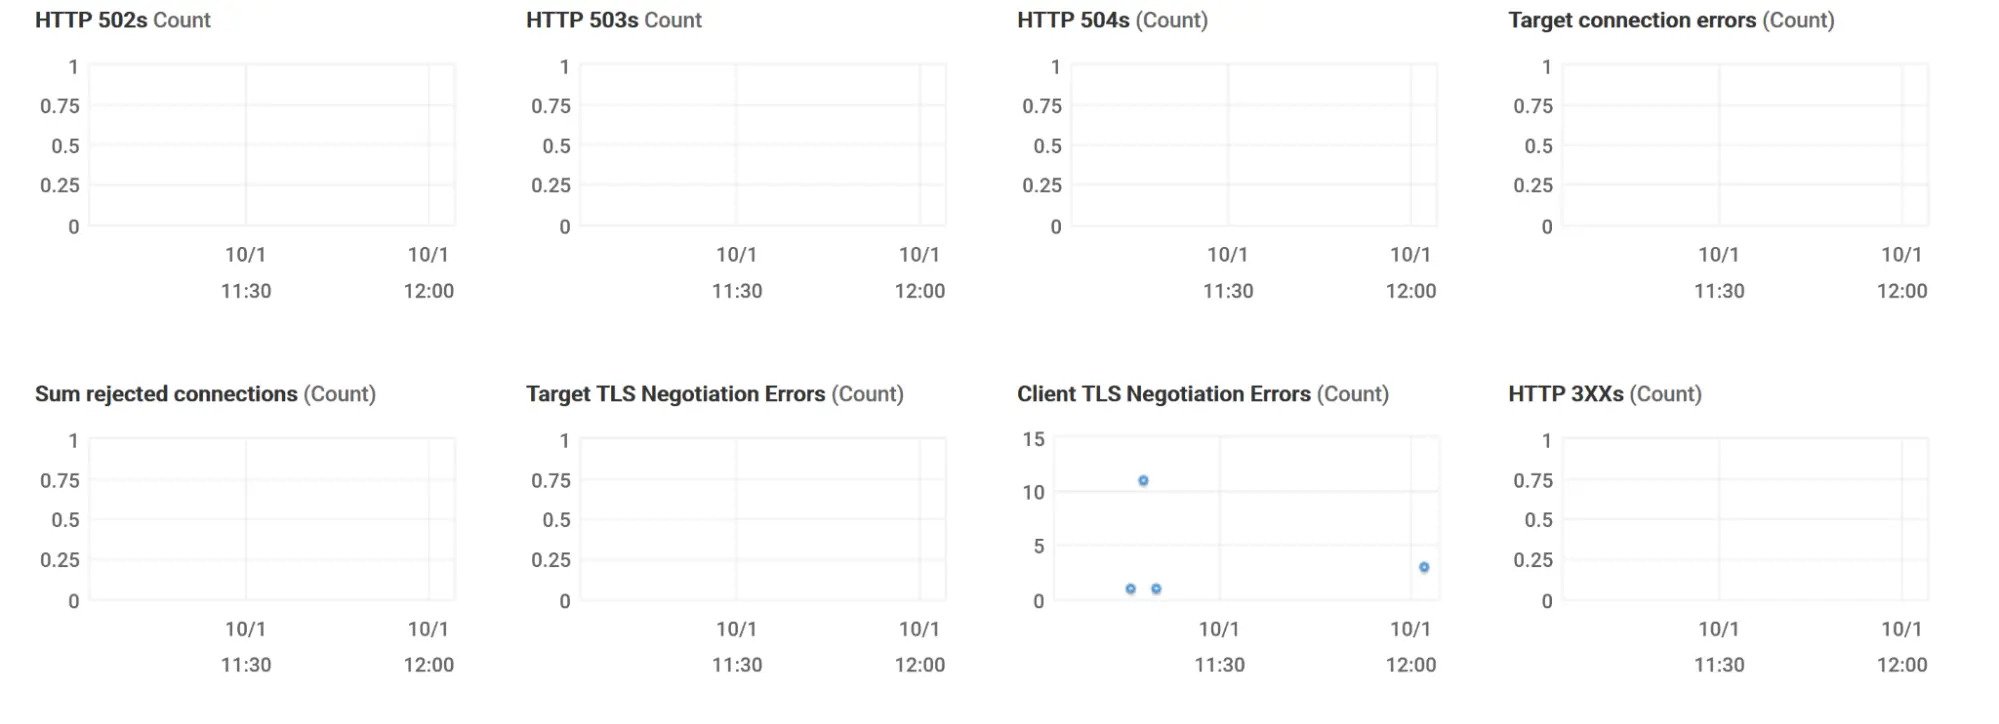
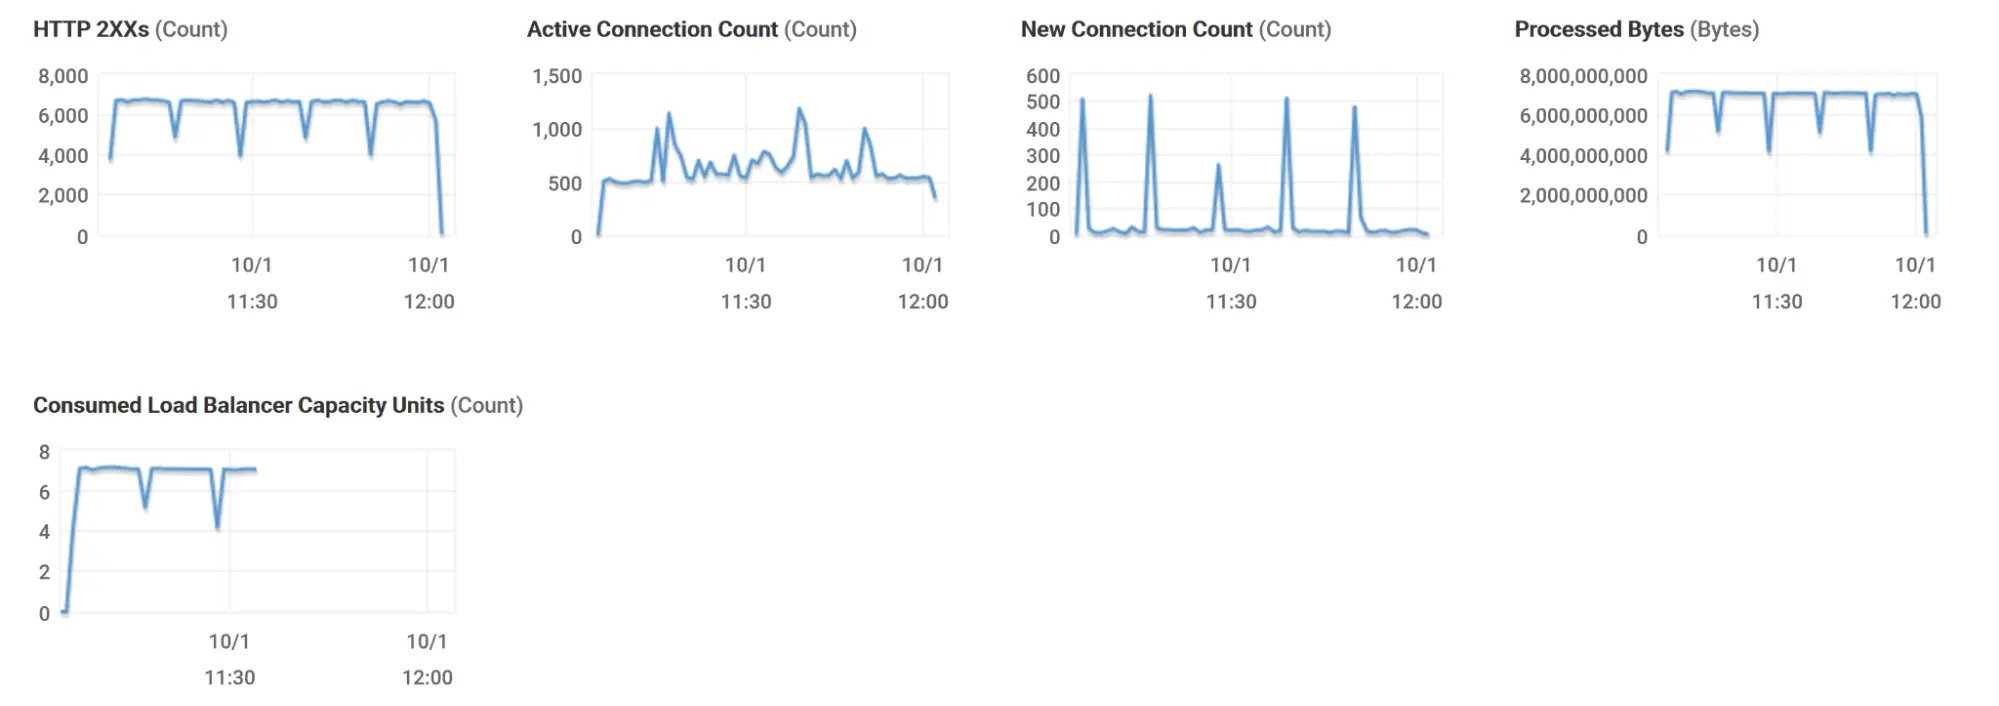
The successful executions, HTTP 2xx success responses, active connections and network utilization appear normal and as expected.
2.1.3 Large Payload Cluster Observations
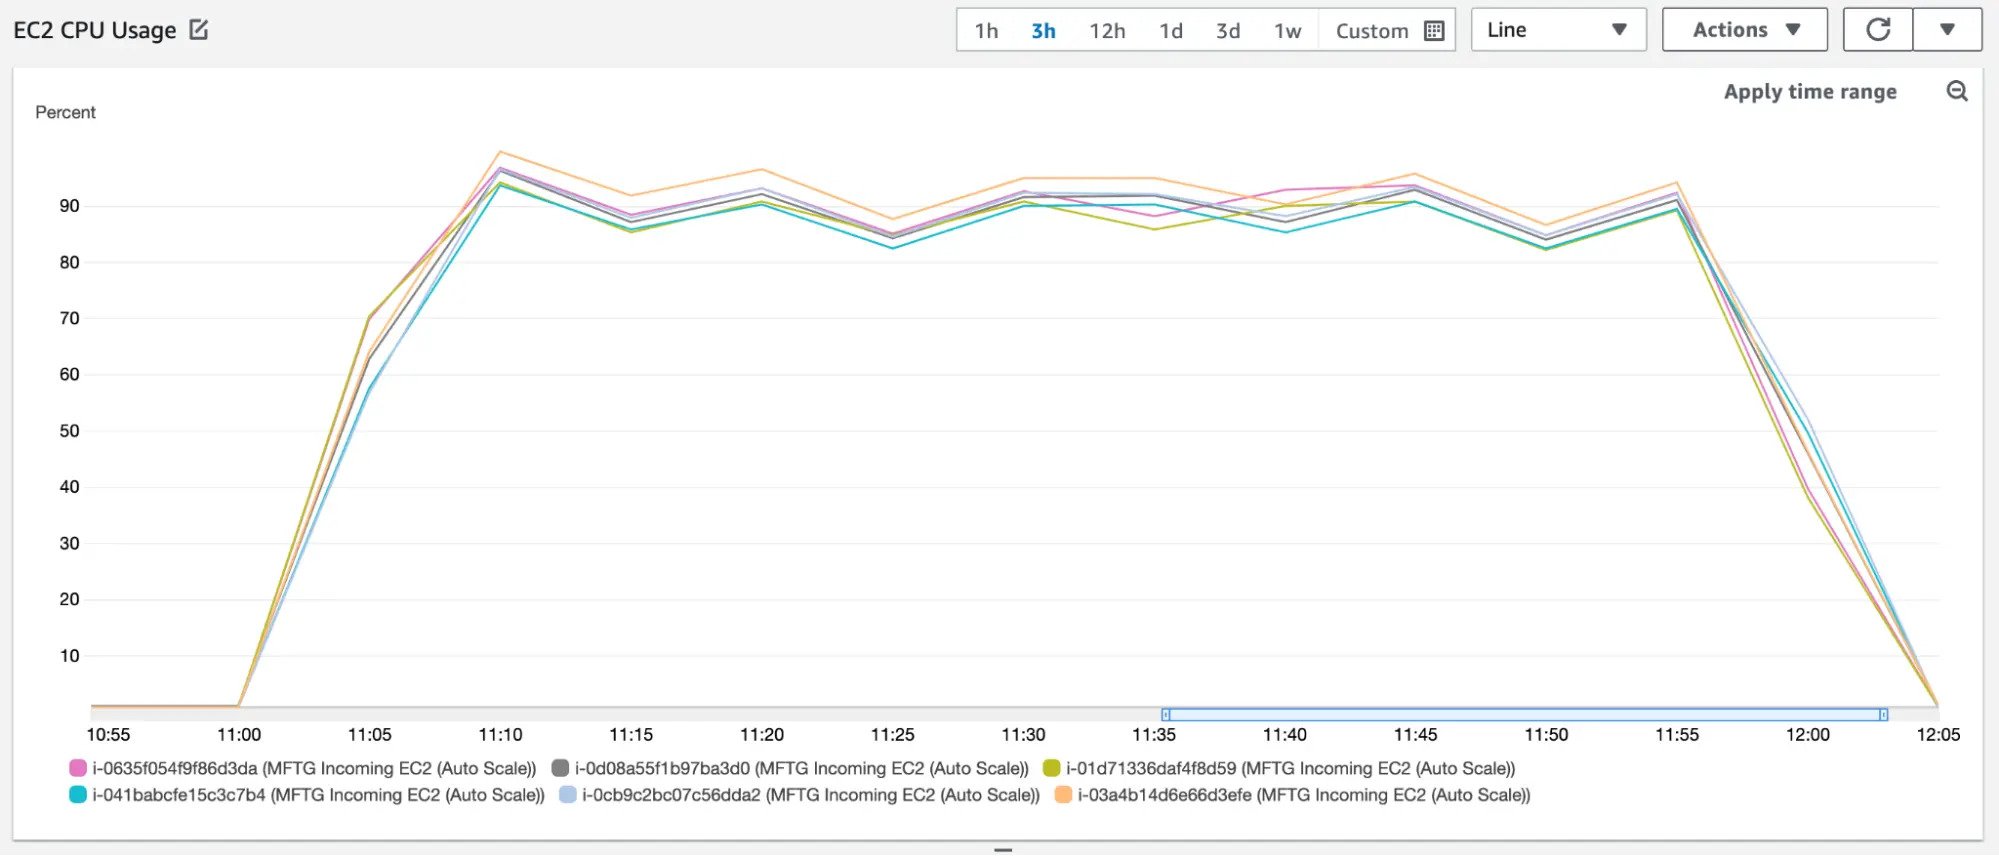
We can see that each instance was utilizing around 90% of the CPU resources during the testing, and all nodes exhibited similar behaviour.
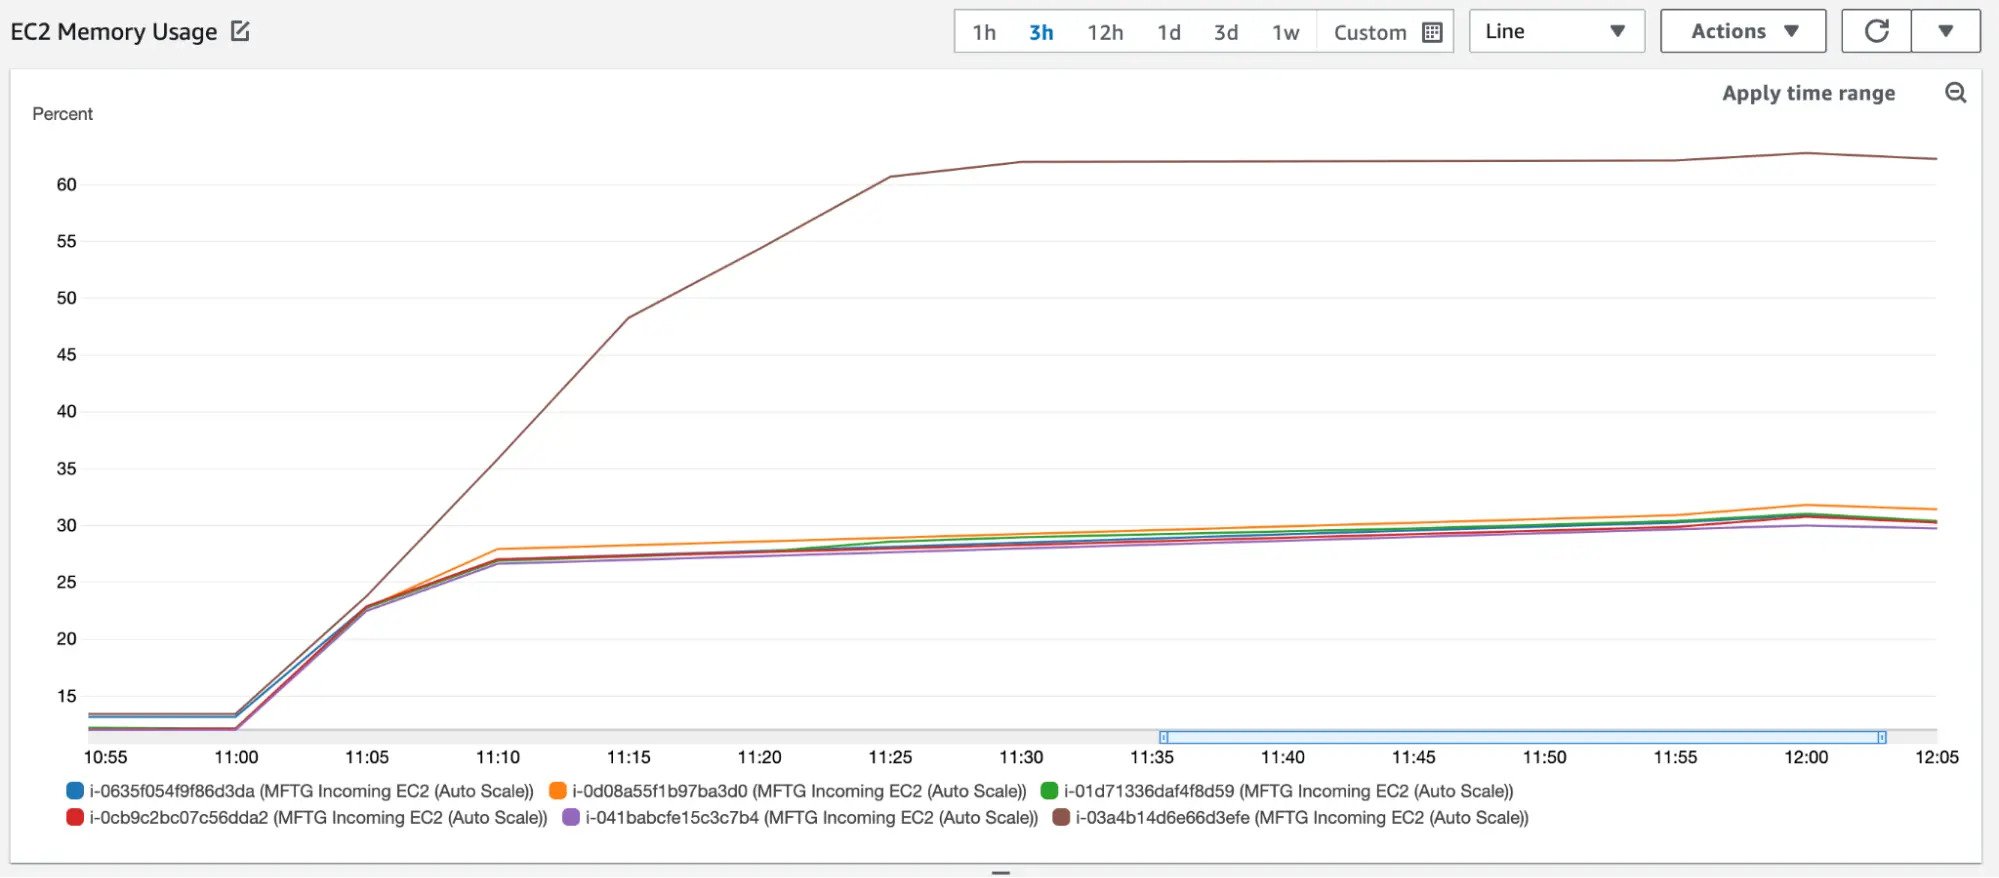
On the memory usage, we notice one instance which utilized more memory than the others. Its memory use gradually increased upto around 60% while the other five nodes, maintained utilization around 30%.
2.1.4 Servlet Receiver Lambda
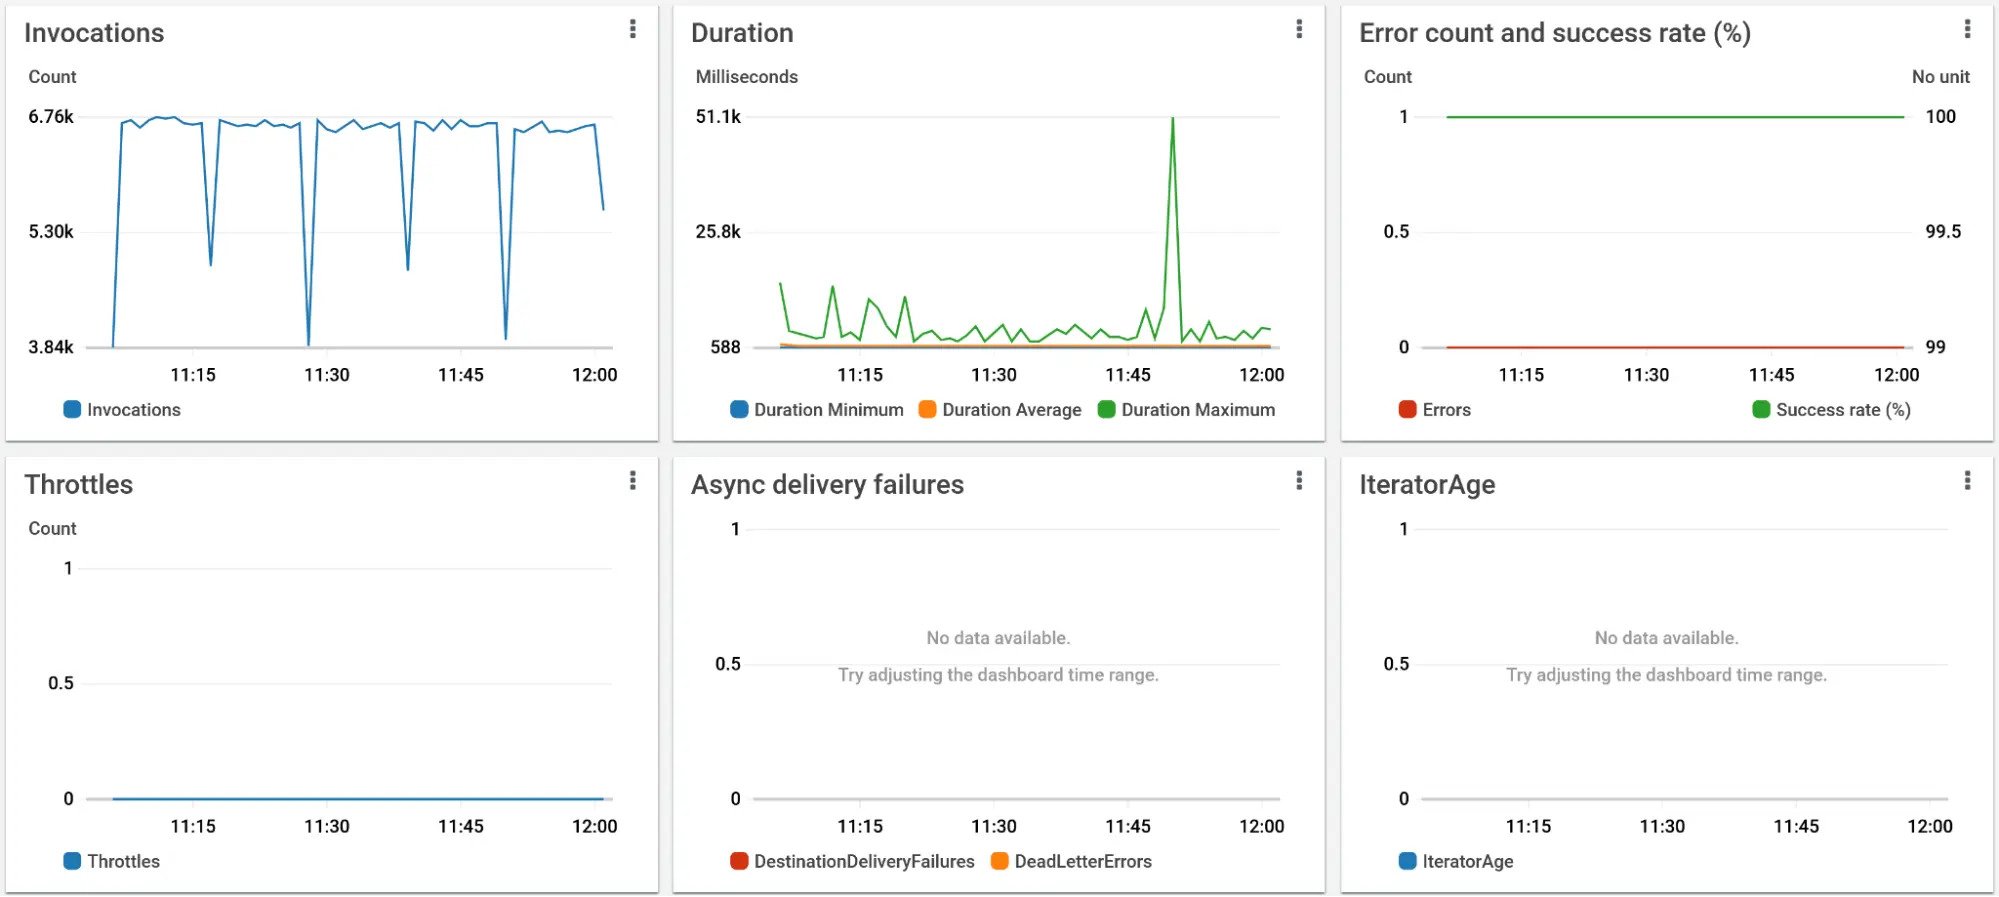
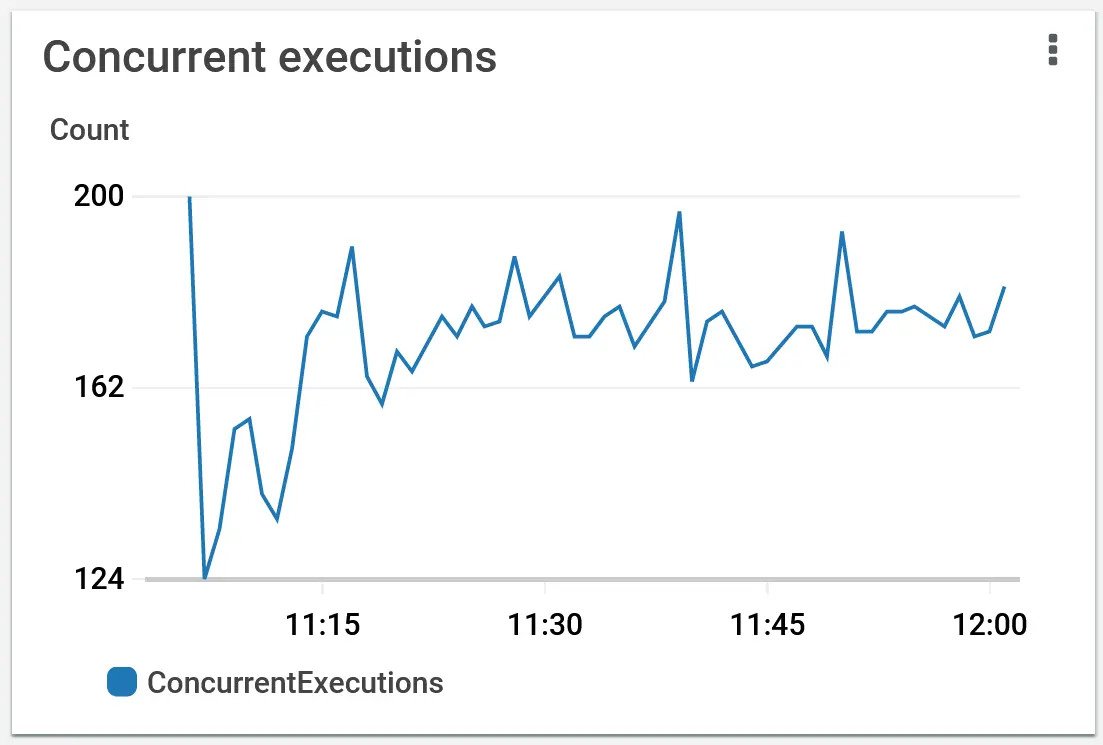
This is the main Lambda function that processes received AS2 messages. It decrypts te raw message, validates the signature, and stores the attachments into the S3 bucket, and updates the metadata in the DynamoDB database. During the testing, we can observe invocations across the five iterations, with an average execution duration of 588ms.
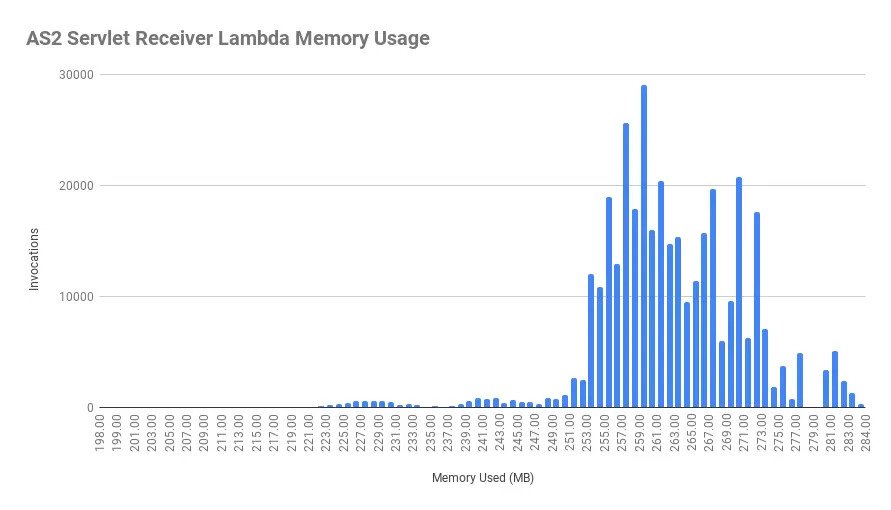
The memory utilization for the processing seems to be between 253 MB to 273 MB for most executions, and the concurrent executions was around 170 on average.
2.1.5 Test Results
The raw output captured via JavaBench across the five iterations are as follows.
Running iteration 0
Document Path:                  http://large-payload.service.loadtest.mftgateway.com/receiver
Average Document Length:        3840 bytes

Concurrency Level:              200
Time taken for tests:           661.030229 seconds
Complete requests:              71994
Failed requests:                3
Write errors:                   3
Total transferred:              76298805070 bytes
Requests per second:            108.91 [#/sec] (mean)
Time per request:               1,836.348 [ms] (mean)
Time per request:               9.182 [ms] (mean, across all concurrent requests)
Transfer rate:                  418.32 [Kbytes/sec] received
                                115,005.75 kb/s sent
                                115,424.08 kb/s total

Running iteration 1
Document Path:                  http://large-payload.service.loadtest.mftgateway.com/receiver
Average Document Length:        3847 bytes

Concurrency Level:              200
Time taken for tests:           646.062181 seconds
Complete requests:              71998
Failed requests:                1
Write errors:                   1
Total transferred:              76303495614 bytes
Requests per second:            111.44 [#/sec] (mean)
Time per request:               1,794.667 [ms] (mean)
Time per request:               8.973 [ms] (mean, across all concurrent requests)
Transfer rate:                  428.74 [Kbytes/sec] received
                                117,676.76 kb/s sent
                                118,105.50 kb/s total
Running iteration 2
Document Path:                  http://large-payload.service.loadtest.mftgateway.com/receiver
Average Document Length:        3849 bytes

Concurrency Level:              200
Time taken for tests:           648.861845 seconds
Complete requests:              71998
Failed requests:                1
Write errors:                   1
Total transferred:              76303642486 bytes
Requests per second:            110.96 [#/sec] (mean)
Time per request:               1,802.444 [ms] (mean)
Time per request:               9.012 [ms] (mean, across all concurrent requests)
Transfer rate:                  427.11 [Kbytes/sec] received
                                117,169.02 kb/s sent
                                117,596.13 kb/s total
Running iteration 3
Document Path:                  http://large-payload.service.loadtest.mftgateway.com/receiver
Average Document Length:        3849 bytes

Concurrency Level:              200
Time taken for tests:           646.041599 seconds
Complete requests:              72000
Failed requests:                0
Write errors:                   0
Total transferred:              76305752140 bytes
Requests per second:            111.45 [#/sec] (mean)
Time per request:               1,794.560 [ms] (mean)
Time per request:               8.973 [ms] (mean, across all concurrent requests)
Transfer rate:                  428.98 [Kbytes/sec] received
                                117,683.78 kb/s sent
                                118,112.75 kb/s total
Running iteration 4
Document Path:                  http://large-payload.service.loadtest.mftgateway.com/receiver
Average Document Length:        3849 bytes

Concurrency Level:              200
Time taken for tests:           651.216166 seconds
Complete requests:              71998
Failed requests:                1
Write errors:                   1
Total transferred:              76303628078 bytes
Requests per second:            110.56 [#/sec] (mean)
Time per request:               1,808.984 [ms] (mean)
Time per request:               9.045 [ms] (mean, across all concurrent requests)
Transfer rate:                  425.55 [Kbytes/sec] received
                                116,745.42 kb/s sent
                                117,170.97 kb/s total
2.1.5 Test Summary
The load test issued a total of 359,988 completed AS2 requests at the large payload endpoint. A total of 12 requests failed. The MFT Gateway was able to consistently receive and process the messages of 1MB, at a rate above 110 TPS. The MFT Gateway received a total of 359,992 messages successfully, which were saved to the DynamoDB metadata store and S3 storage. The difference between this number and the success count at the load generator is due to 4 requests which completed processing at the MFT Gateway, but not receiving the successful HTTP response at the load generator before the connection timedout.
2.2 AS2 Sending and API Gateway Receive Load Test
This load test was a loopback test. It signed, encrypted and sent a text file of 1,048,576 bytes (~1MB) - out of the MFT Gateway, and back into the MFT Gateway. The files were received to the API Gateway based endpoints. A total of 360,000 files were copied to be sent out and received.
2.2.1 AS2 Sending Lambda Observations
The ‘MFT-Gateway-AS2-Sender’ lambda function was responsible for the creation and sending out of AS2 messages, to the API Gateway endpoint. This was allocated 2,048 MB (~2G) of RAM, and provided with the maximum 15 minute timeout.
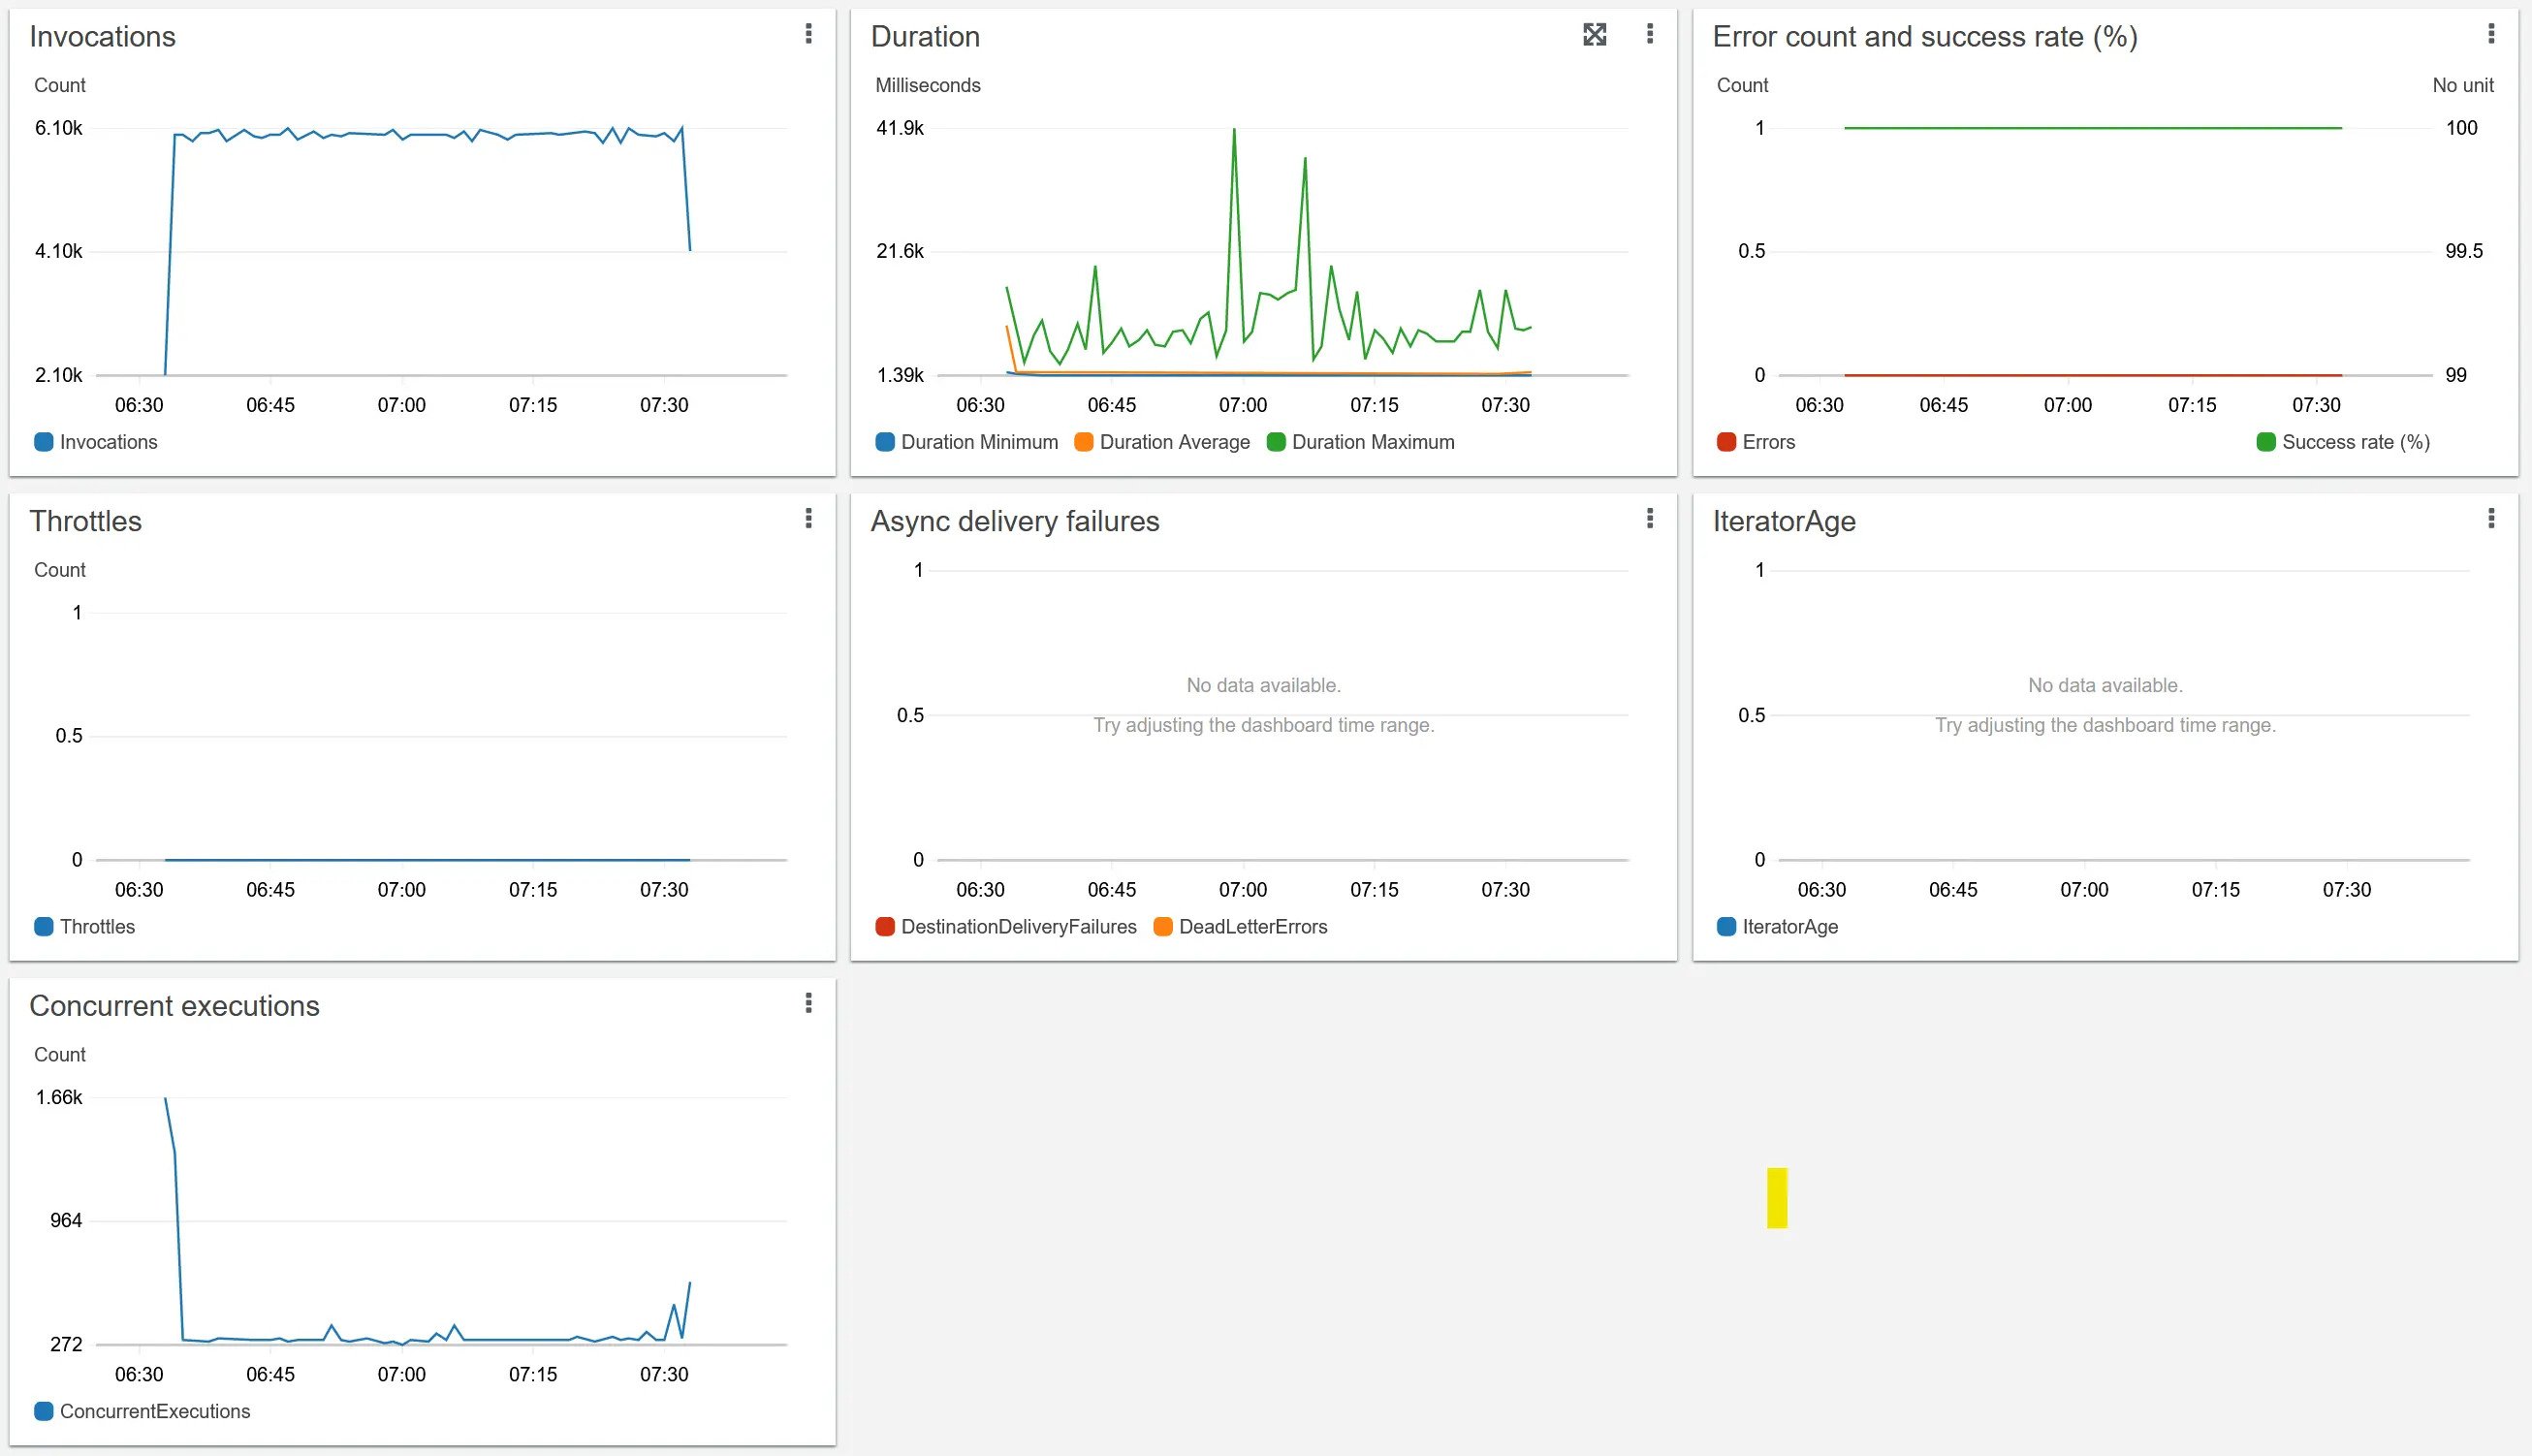
The processing took around ~1,725ms on average, and had close to ~300 concurrently executing instances of the Lambda function.
2.2.2 AS2 Receiving Lambda Observations
The ‘MFT-Gateway-AS2-Receiver’ lambda function was responsible for the processing of incoming AS2 messages, received via the API Gateway endpoint. This was allocated 2,048 MB (~2G) of RAM, and provided with the maximum 15 minute timeout.
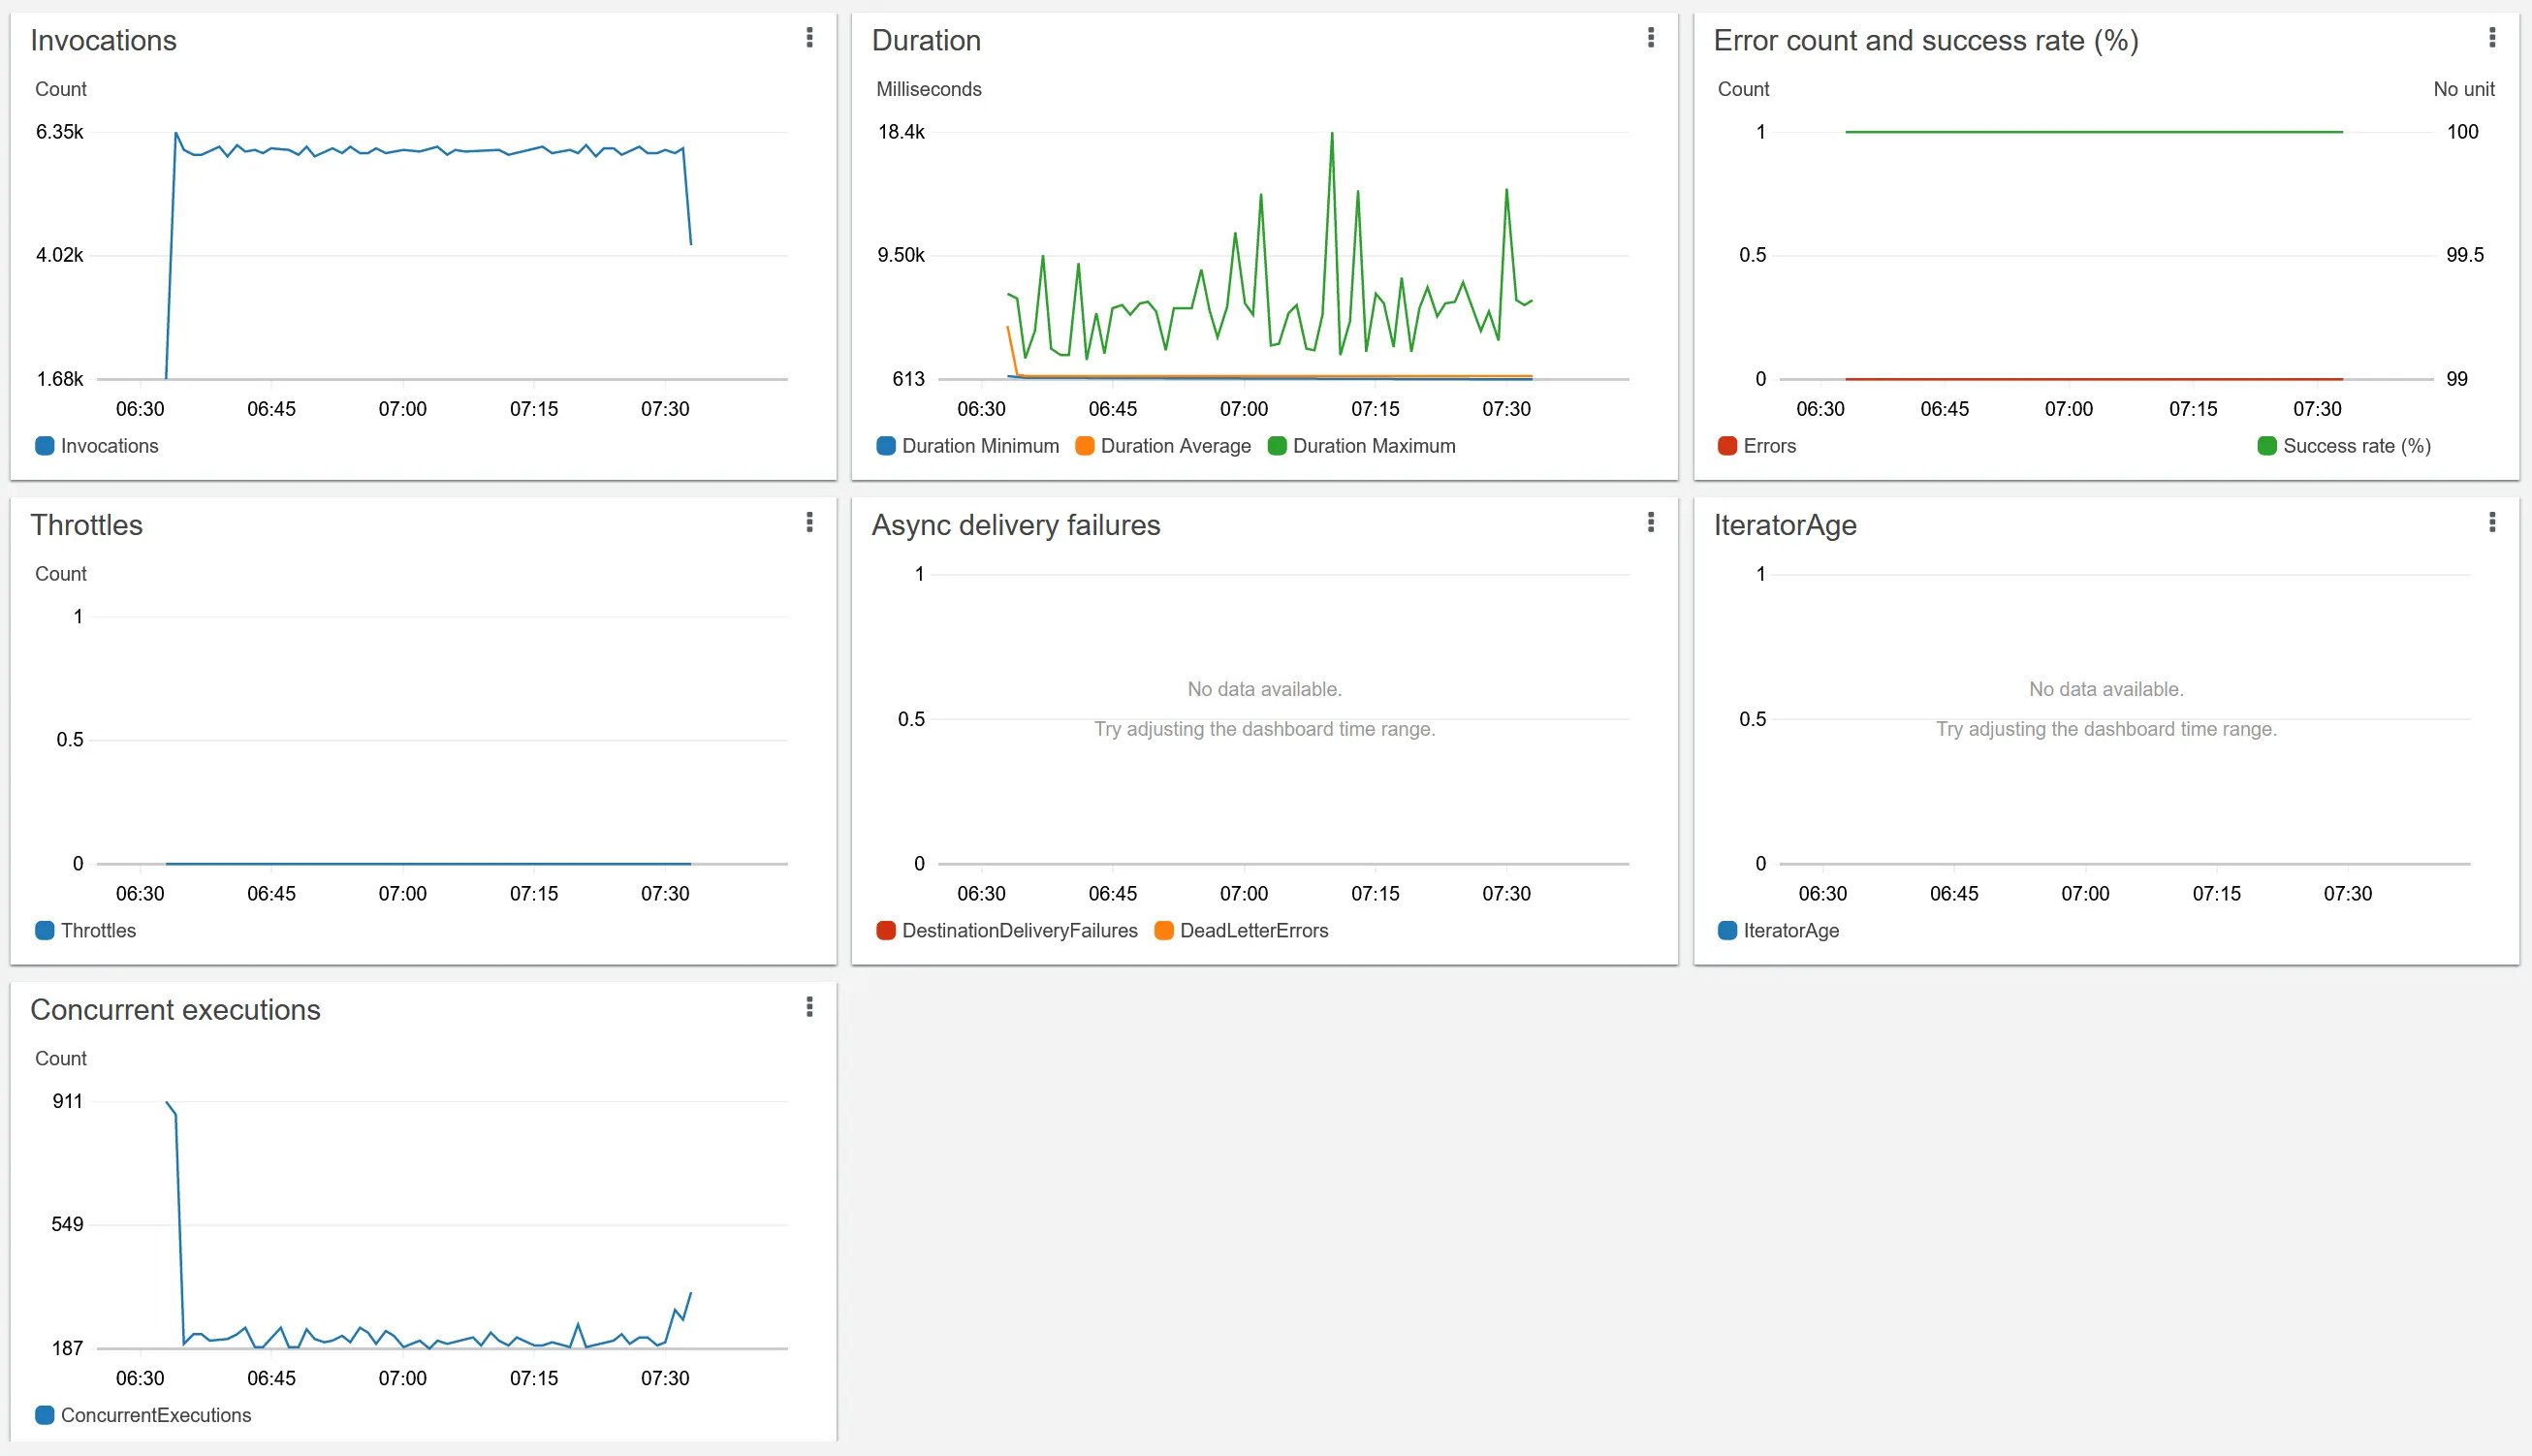
The processing took around ~840ms on average, and had close to ~190 concurrently executing instances of the Lambda function.
2.2.3 AS2 Receiving API Gateway Observations
The API Gateway endpoint which fronted the AS2 receiver Lambda showed the following metrics. The average latency was around ~885ms.

2.2.4 Test Summary
The load test triggered the sending out of 360,000 text files of ~1MB in size. All of the files were received successfully, and matched both the received S3 bucket statistics and DynamoDB meta data. The test executed for 51 minutes, yielding a TPS of ~118.
2.3 Long-running Load Test
This load test was executed for a period over 12 hours, to measure the capability of the system under continuous load. Due to the costs and overhead involved, this test was executed against one Large payload EC2 instance at a concurrency of 30 users (i.e. concurrent connections), with each executing 2,000 requests across 24 iterations. The total messages transferred was 1 x 30 x 2000 x 24 = 1,440,000 messages. The test was executed similarly to the test described in Section 2.1.
2.3.1 Long-running Test Observations
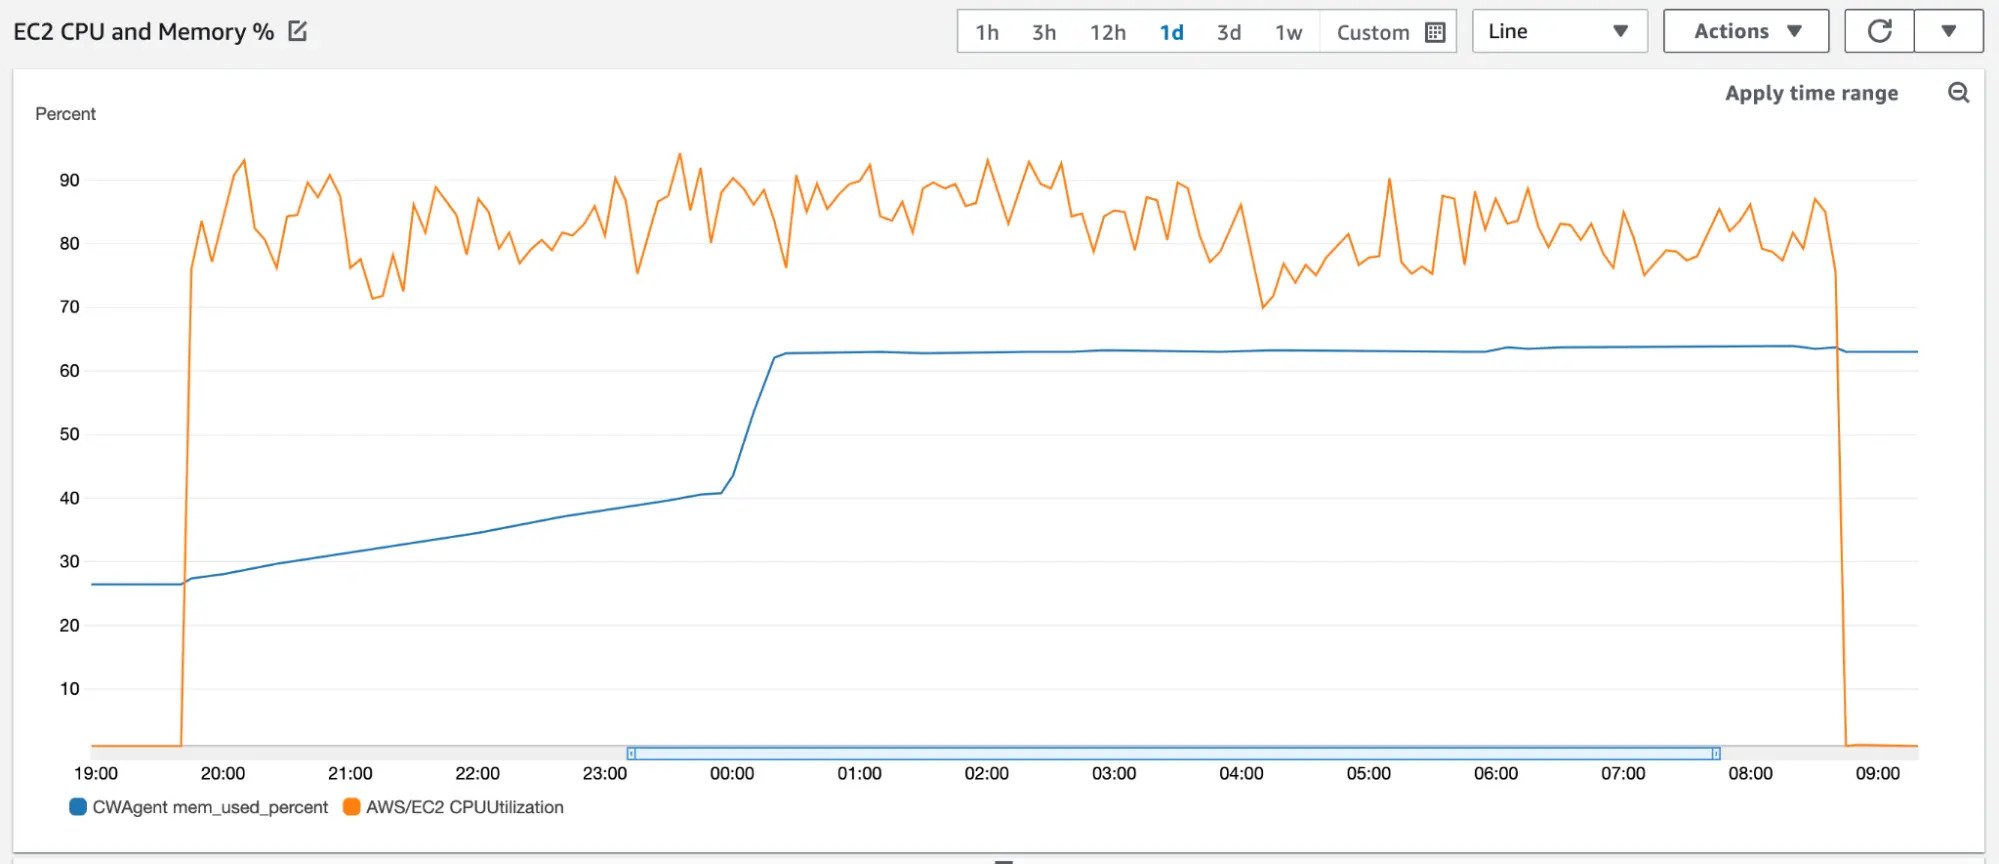
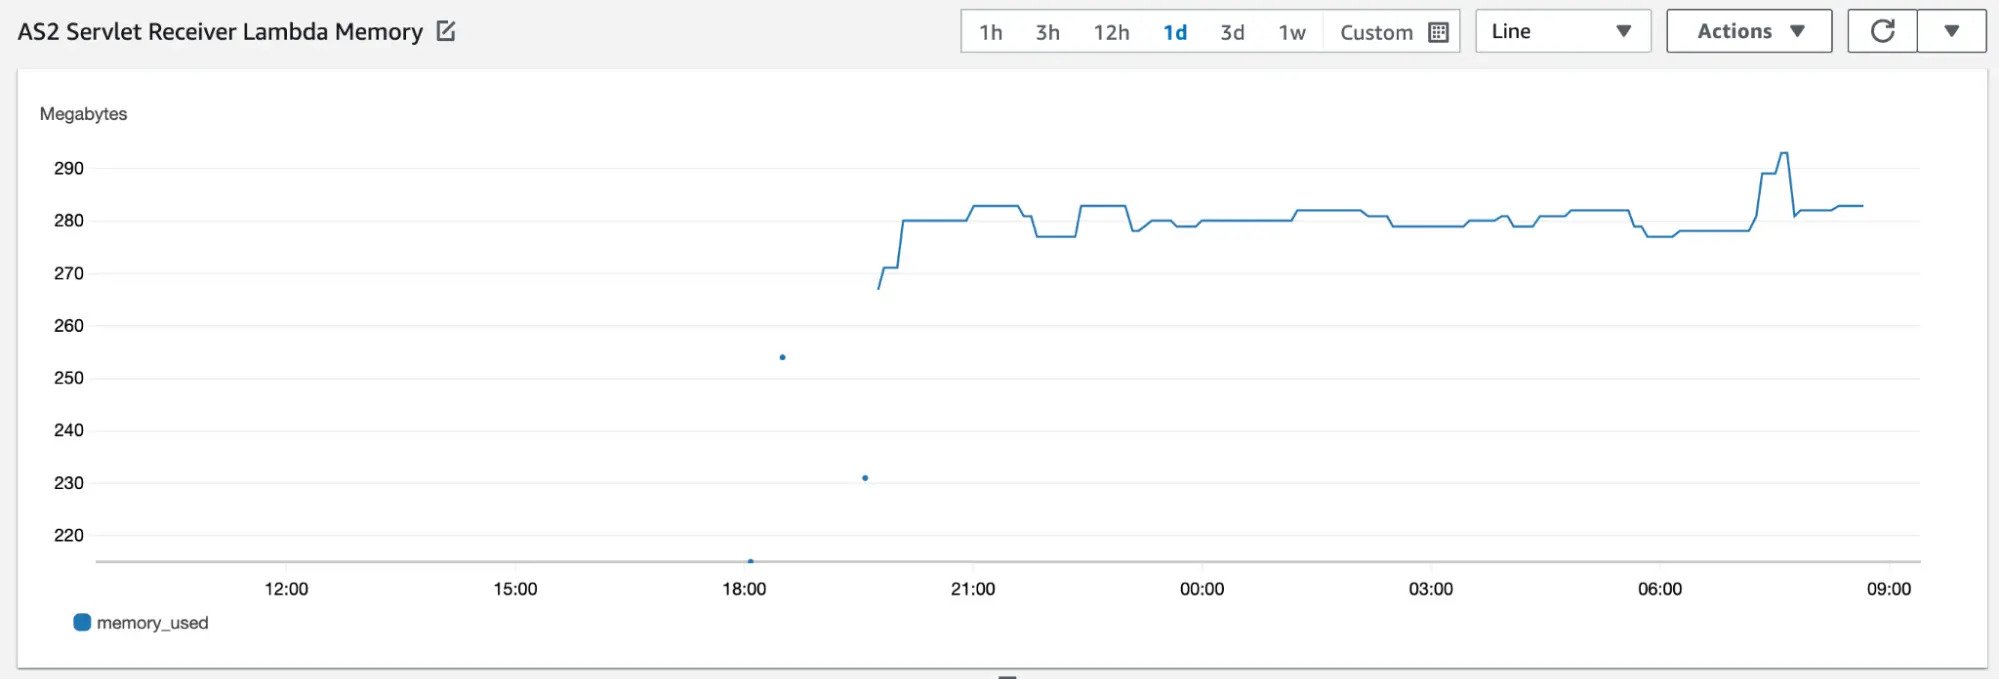
The EC2 instance was using around ~80% CPU and around 63% of the memory allocated to the system.
The Servlet running on Tomcat utilized around ~280MB of heap memory during the test.
2.3.2 Test Summary
A total of 1,440,000 messages of ~1MB was handled across a period over 12 hours, on a file of size ~1MB. The test executed for around 13 hours, giving an TPS of 31. Extrapolating this across 24 hours, and 6 node EC2 auto-scale group yields around 16 million messages of ~1MB per day.
3 Results Summary
This load test was performed in October 2021, as a preparation for a customer proof-of-concept performance test, where a 100 TPS load, and processing of a million messages per day was the target. During the testing, it was observed that the MFT Gateway can surpass these metrics many times over. With the scalability of the underlying AWS cloud platform, any increase of load will actually translate into a test of the underlying cloud platform.
The Aayu Technologies team will be happy to open up this deployment for any customer proof-of-concept or load testing, or allow this test to be carried out on a customer owned AWS account for full transparency and observability.
We welcome any suggestions and feedback on this performance test, and expect to run an updated test again in a few months.


