


Hosted SaaS solution for AS2 and SFTP file transfer. No infrastructure, instant setup.
Start Free Trial
Learn the key features of an efficient EDI dashboard, intuitive design, real-time tracking, and actionable insights for seamless operations. Read now!

Sampavi Sriparan
Modified: 11 Nov 2025

In the digital era, reliable and valid exchange of Electronic Data Interchange (EDI) messages has been a necessity in order to maintain operational smooth running of businesses. Without the right tools, the management becomes complex. A good EDI dashboard is a must in these situations. An EDI dashboard is a central interface that offers real-time visibility, control, and insights to the process-related functions of electronic data exchange. The quality of the dashboard has the potential to have a significant effect on the success of its operational facts, such as monitoring acknowledgments or identifying and resolving and trend analysis problems for performance improvement, and proactive insights through predictive analytics.
This article will focus on the important features that make an EDI dashboard both highly functional and outstanding.
An EDI dashboard must remain user-friendly, scalable, and filled with productivity- and operations-simplifying features to retain competitiveness.
A user-friendly interface forms the foundation of any EDI dashboard that works well. It plays a key role in how and well users can find their way around and use main features. An intuitive, well-designed interface makes things simpler and delivers users a seamless experience.
Clean layout: A clutter-free layout and clearly-defined sections provide the user with an intuitive way to find the information. Readability depends on ease of navigation, group organization, and semantic use of separation of space.
Ease of navigation: The interface should be easily navigated between sections and ideally by well-defined menus, dashboard navigation. For instance, the availability of a global search bar or quick filters allows the searcher to easily and automatically locate a specific transaction or piece of information rather than tally the same manually.
Customizable dashboards: Different users have varying priorities. Providing different types of widgets, animateable elements, and adaptable data views enables the individual customization of the work space by the user.
User-friendly design: Intuitive icons, self-explanatory labels, and tooltips enhance usability. E.g., statuses, such as “processed”, “failed”, or “pending”, may be color-coded for quick identification.
Operational visibility: Message states like queued, outbox, processed, or failed, provide instant operational visibility and help users quickly track the flow of messages and the status of their delivery. Exporting all message data to CSV strengthens operational visibility and supports transparency and analysis.
Real-time data visualization is an essential capability of a good EDI dashboard, providing users with on the fly access to the status of transactions, system performance and relevant measures. It guarantees that organizations will be in a situation to be informed and make appropriate decisions by providing complex data in a simple and comprehensible way.

Live updates: An effective dashboard performs in real time by giving the current status of the transaction, the time required for the processing, and the errors that occur every time. Users should not have to reload or relocate themselves to another page to view the most recent information.
Interactive visual elements: Charts, graphs, and widgets simplify complex data by allowing users to zoom in, filter, or hover for additional details. For instance, a bar chart could display the number of transactions processed each day and offer options to look into transactions that failed or were delayed. This approach makes understanding the data much easier.
Transaction monitoring at a glance: Use visual cues, such as progress bars, pie graphs, or summary counters, to give an overview of processing statistics (i.e. number of successful transactions, failed transactions with reasons, pending acknowledgments like EDI 997 and total documents processed by type (e.g., invoices, purchase orders)
Error highlighting: Data visualization tools should highlight anomalies or errors prominently, using distinct colors like red or orange for failed processes. This helps users identify and address issues quickly. Highlighting errors such as fields that are left blank or incorrect data assists users in finding and fixing problems within transactions or forms.
Real-time metrics dashboard: Allow users to monitor performance in real time, such as average document processing speed, acknowledgment latency, or peak transaction periods.
Trend analysis and forecasting: Illustrate the trends using dynamic graphs over time (hourly, daily, weekly). This allows businesses to predict transaction spikes, identify recurring faults or track compliance of partners.
All information representation on an EDI dashboard allows companies to perform their transaction data analysis directly and effectively to derive knowledge that can be used to improve operation.
Predefined reports: Flexible templates for frequently needed reporting, e.g., transaction volume, error analysis, and partner performance.
Customizable options: or personalized reports users can drop filters and parameters as well as criteria.
Exportable formats: Implement exporting data as CSV, PDF or Excel for subsequent analysis or dissemination.
Historical data: Access transaction logs for particular time intervals to identify whether patterns, or verify compliance.
Establishing a strong notification system aids companies in anticipating problems and ensuring seamless EDI operations. It serves as a channel of real-time communication, warning users of important occurrences or interruptions so they can take prompt action and prevent expensive delays or compliance issues.
Event-based alerts: Notifications for problems such as transaction failure, acknowledgment delay, or file loss.
Multichannel delivery: Notification as e-mail, SMS, or in-app notification depending on the user’ preference.
Customizable triggers: Users can also program alerts for particular events or thresholds (e.g., transaction volume, or processing time).
Prioritized notifications: Categorize the alerts based on severity (e.g., critical, warning, informational) in order to guide the users to prioritize critical issues.
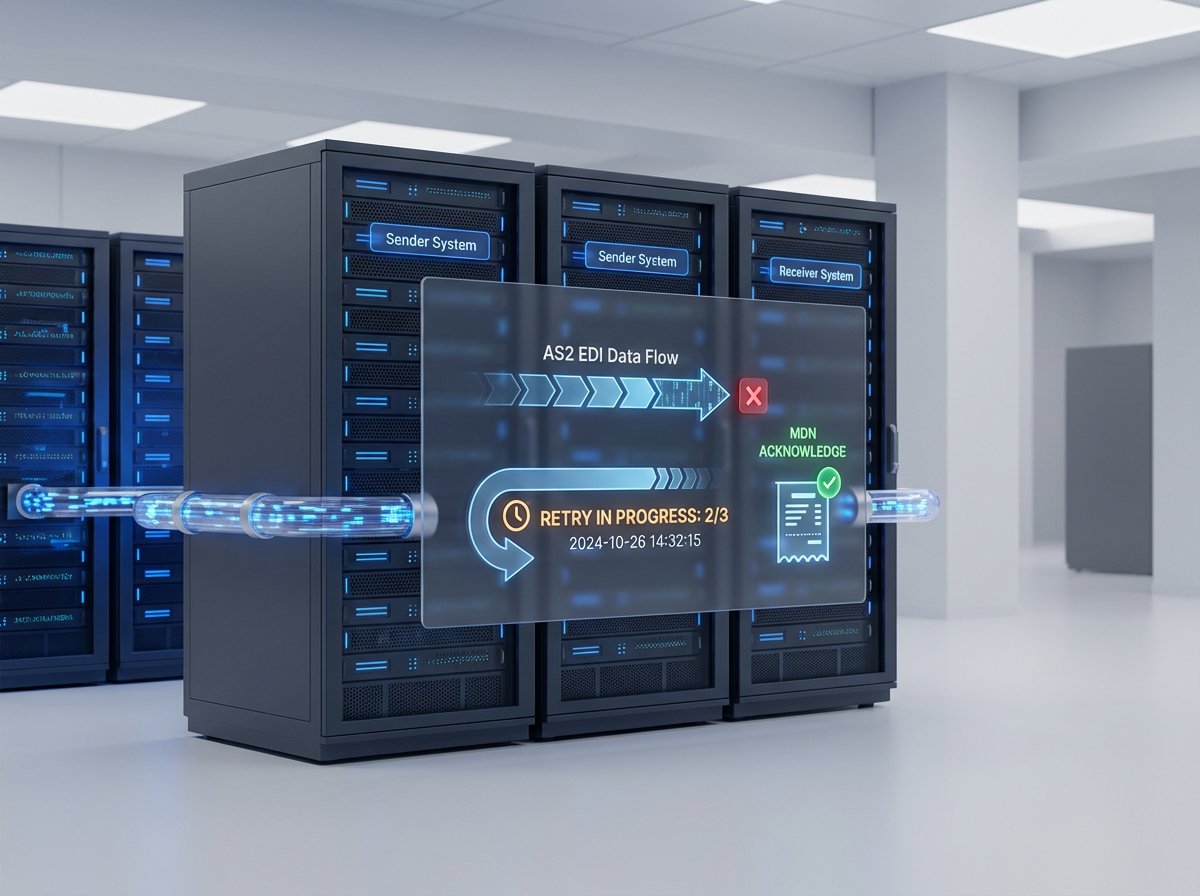
One of the most important functions of an EDI dashboard is transaction monitoring. It ensures operational efficiency and business continuity by providing users with real-time visibility into the complete data exchange process, from processing and acknowledgement to completion. In the EDI system, efficient monitoring tools also aid in the early detection and resolution of anomalies.
Real-time status updates: The status of any transaction that is currently under way, processed, completed, acknowledged, pending, or failed is displayed by the system. Live updates give immediate visibility of the transaction process since no manual refresh is needed.
Error detection and analysis: Error sign detection of failed transmissions, lost acknowledgements and rejected documents: The recorded error information with timestamps and error codes allows operators to also quickly diagnose and solve problems.
Filtering and search functionality: The ability to transform allows users to quickly look up individual transactions from defined characteristics such as transaction type (e.g., EDI 850 Purchase Order), date, partner name, status, or tracking ID. Configurable filtering thereby facilitates the management of large transaction volumes.

A Well-designed EDI dashboard improves performance by giving live visibility, transaction control, detailed reports, and forward notifications to keep business operations running smoothly. Our EDI Generator follows these guidelines, providing ease of use, real-time status, all-inclusive reporting, and automated alerts to maintain smooth running of your operations. Featuring error detection, audit trails, and integration into many applications, it guarantees both compliance and efficiency, and minimises manual labour. Advanced features like predictive monitoring and customizable dashboards empower businesses to stay ahead of potential issues and optimize their workflows. By leveraging EDI Generator, organizations can enhance accuracy, streamline processes, and build stronger trading partner relationships making it the ideal choice for a powerful and efficient EDI dashboard.
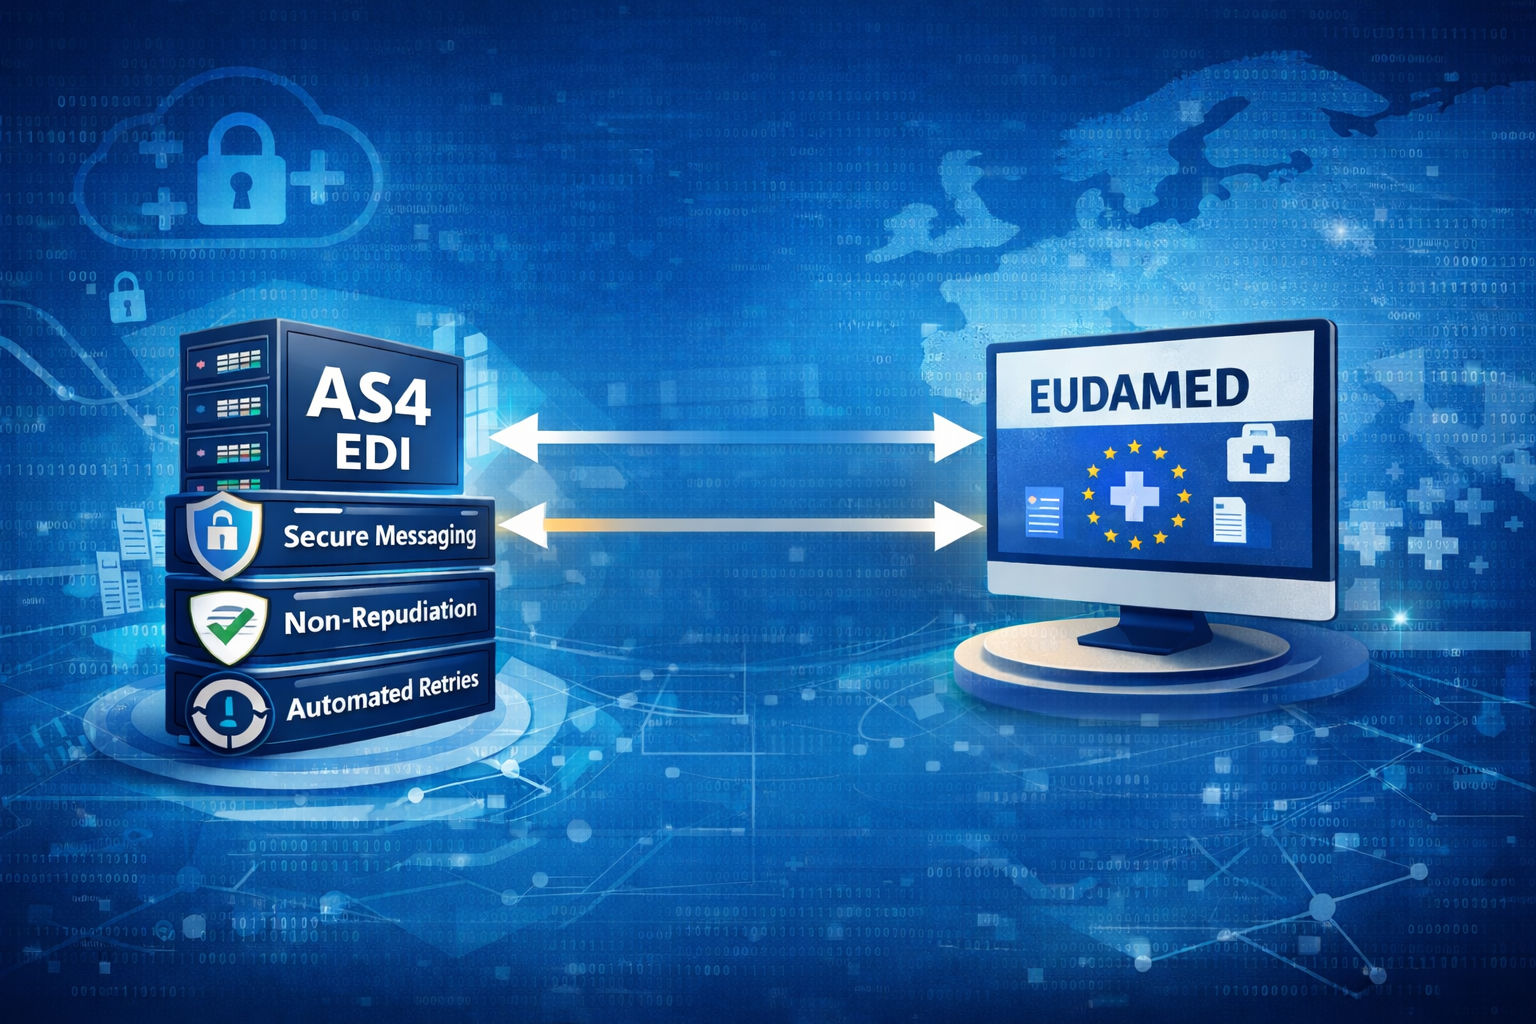
Join hundreds of organizations already taking full control of their B2B AS2 communications with our trusted solutions. Contact us today to tailor a solution that fits your specific AS2 EDI needs.
Get full access to whichever product fits your needs. Configure real trading partner connections, run end-to-end transactions, and see the platform perform before making any commitment. All three products include a free 30-day trial with no restrictions.
